How to Connect Power BI to SharePoint Online List?
Over the years, business intelligence has become increasingly important in decision-making processes. Power BI is one of the most popular tools organizations use to create and share interactive dashboards. In this article, I will discuss how to use Power BI to create reports from SharePoint Online Lists.
We will explore the benefits of using Power BI to streamline data analysis, how to connect Power BI to SharePoint Online Lists, importing SharePoint List data into Power BI, creating reports from SharePoint data using Power BI, customizing and sharing reports from Power BI to SharePoint Online. We’ll also look at some of the tips and tricks for efficient data analysis using Power BI and SharePoint Online, and best practices for data visualization and presentation in Power BI. And finally, the frequently asked questions about Power BI integration with SharePoint Online Lists take your data analysis to the next level.
Table of contents
- Introduction to Power BI and SharePoint Online Lists
- Benefits of using Power BI to streamline data analysis
- Connect Power BI to SharePoint Online List to Create Reports – Step by Step
- Tips and tricks for efficient data analysis using Power BI and SharePoint Online
- Best practices for data visualization and presentation in Power BI
- Conclusion and next steps
Introduction to Power BI and SharePoint Online Lists
Power BI is a business analytics service by Microsoft that allows users to visualize and analyze data from a wide range of sources. It equips you with interactive visualizations and business intelligence capabilities. By providing an intuitive interface, Power BI allows you to create your reports and dashboards with relative ease. With SharePoint Online, users can collaborate, share, and store documents and data in the cloud. Connecting Power BI to a SharePoint Online list enables you to easily extract data from SharePoint and create reports that are visually appealing and easy to understand.
Benefits of using Power BI to streamline data analysis
By bringing together data from multiple sources and presenting it in one place, Power BI can streamline data analysis. This allows for more efficient analysis and better decision-making. Power BI also offers a wide range of visualization options, making it easy to create reports that are both informative and visually appealing.
Another benefit of using Power BI is the ability to share reports and collaborate with others. Reports can be shared with specific individuals or groups, and users can add comments and annotations to reports, making it easy to work together on a project. Additionally, Power BI offers a range of security and privacy features, ensuring that sensitive data is protected.
Connect Power BI to SharePoint Online List to Create Reports – Step by Step
Before you can create reports from SharePoint Online Lists using Power BI, you first need to make sure you have access to both Power BI (the desktop application) and the SharePoint Online site that contains the list you want to connect. Assuming you have an existing SharePoint list with data, let’s dive into the steps to effectively connect Power BI to SharePoint Online List:
To connect Power BI to SharePoint Online, you will need to follow these steps:
- Open Power BI Desktop: To start with, ensure you have the Power BI desktop application installed on your system, You can Download Power BI Desktop and install the application on your computer to start creating interactive reports and dashboards.
- Get SharePoint Site URL: Go to your SharePoint site and navigate to the list you want to connect to. Copy the URL from the browser’s address bar. Make sure you copy the URL up to, but not including, “/Lists” or “/AllItems.aspx” or anything that comes after the base URL of the list. E.g., https://crescent.sharepoint.com/sites/operations
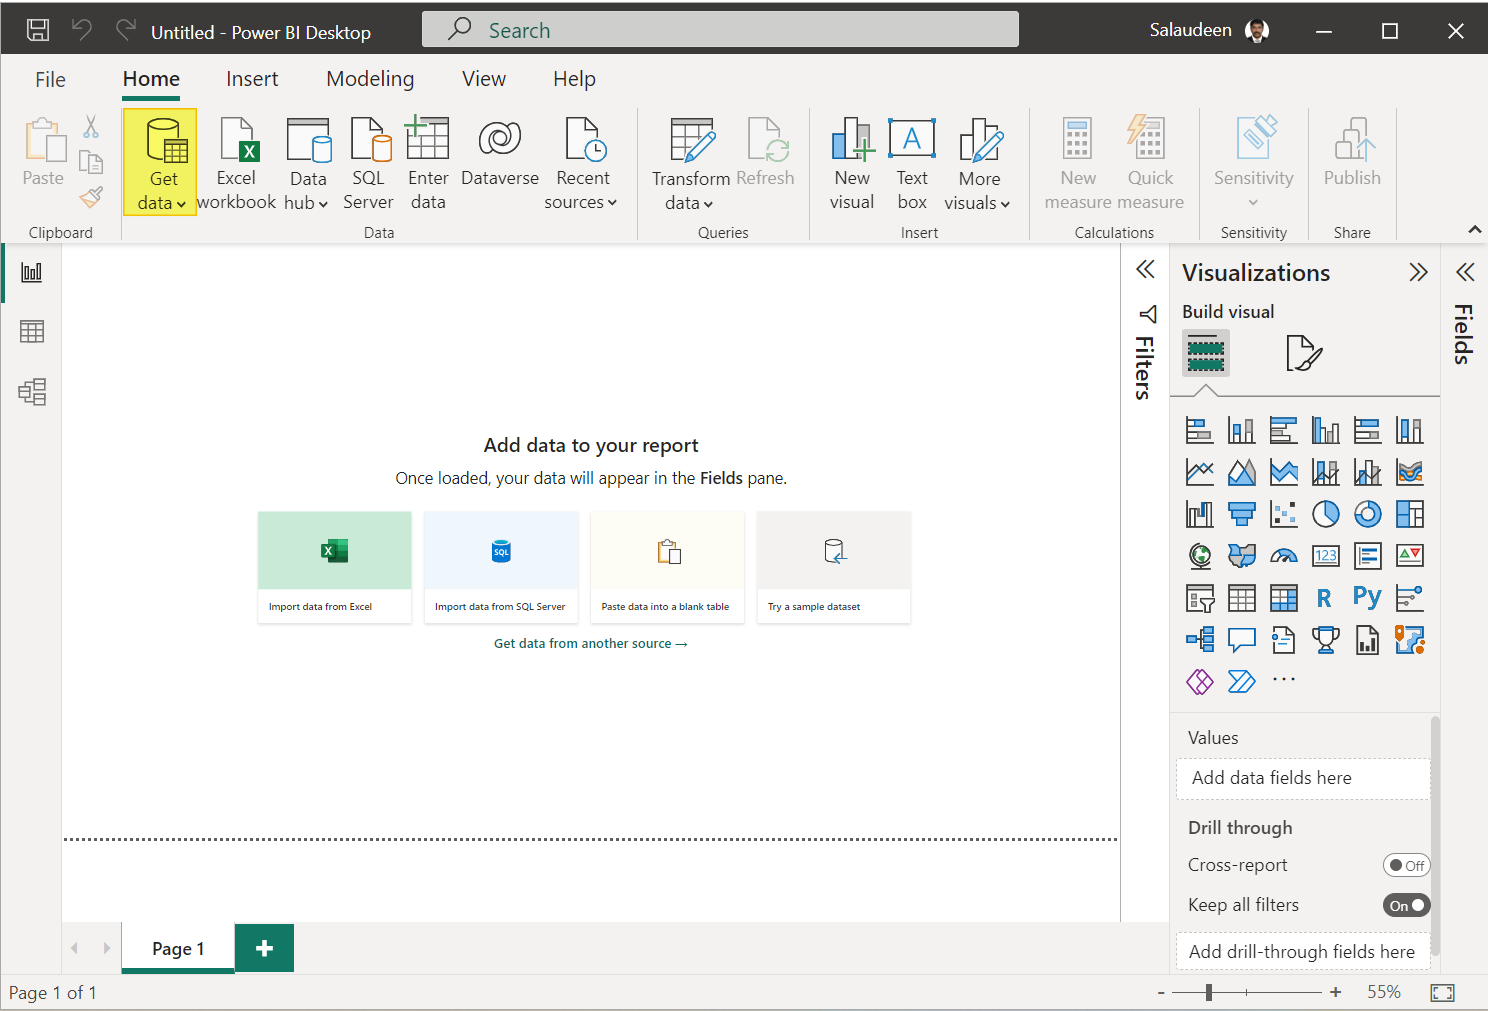
- Connect to SharePoint Online List: Open the Power BI Desktop application, and click on the “Get Data” button in the Home tab of the ribbon.

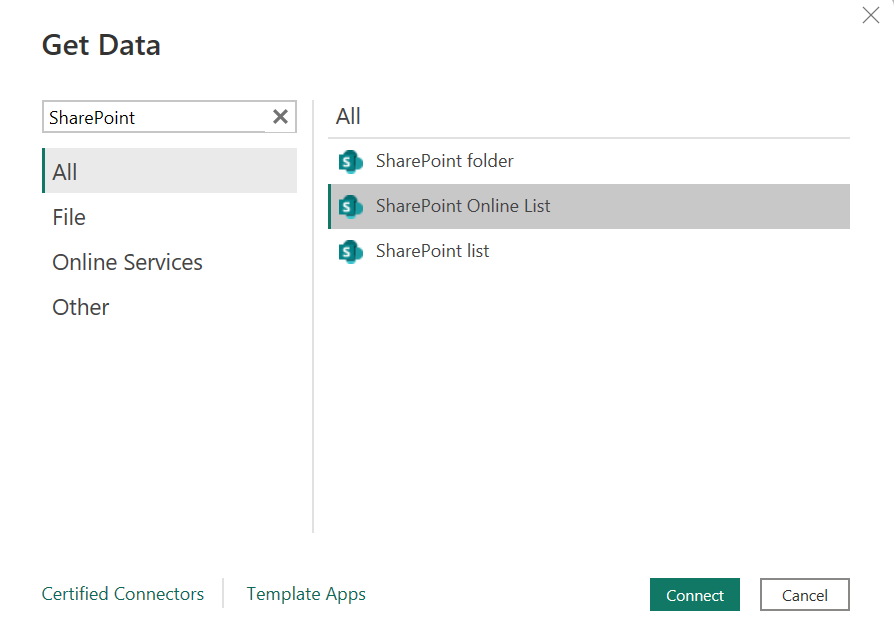
- Select “SharePoint Online List” data Source: In the window that appears, search for “SharePoint” in the search bar and select “SharePoint Online List”. Click “Connect”.

- Enter the SharePoint Site URL: In the window that appears, paste the SharePoint site URL you copied earlier. Click “OK”.

- Sign In: You will be prompted to enter your user name and password. Use the Microsoft account credentials that has access to the list on SharePoint.
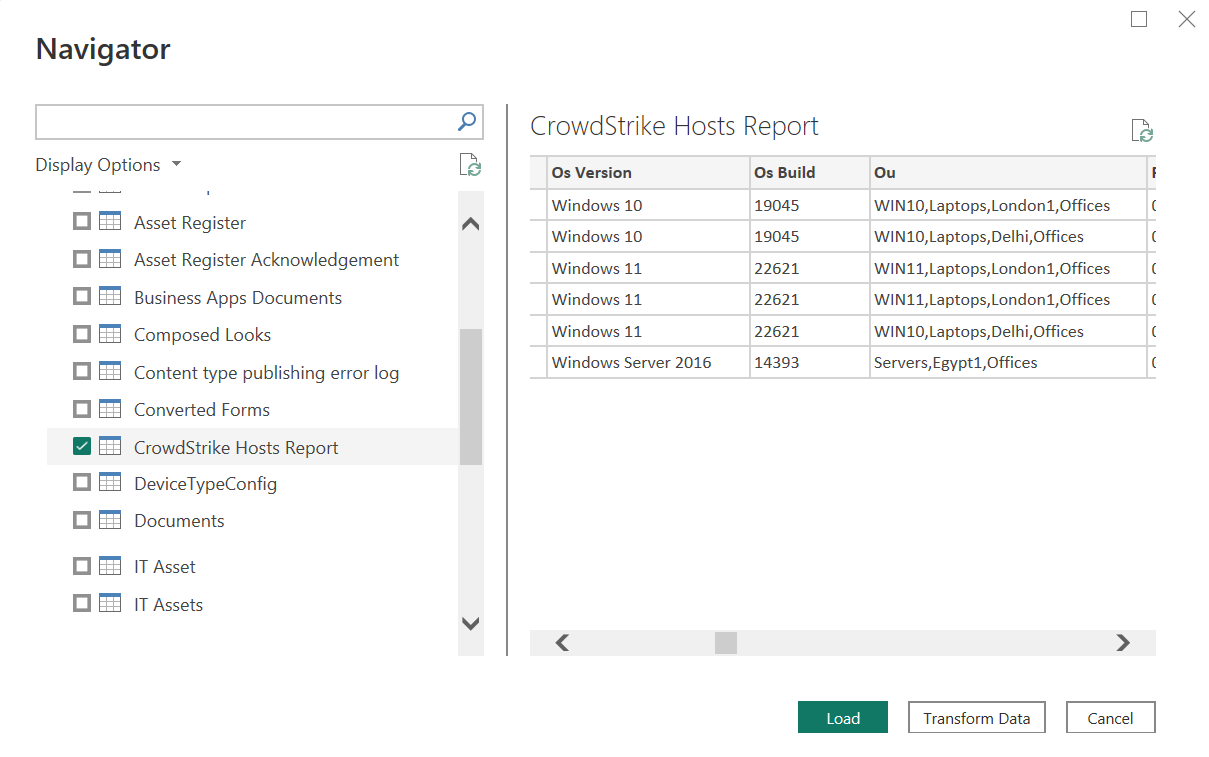
- Select the List and Load Data: Once authenticated and connected, Power BI will display a Navigator window where you will see all the available lists and libraries from your SharePoint site. Select the list you want to connect and click “Load”. Once you have connected Power BI to SharePoint Online, you can begin importing data into Power BI and creating reports from the SharePoint dataset.

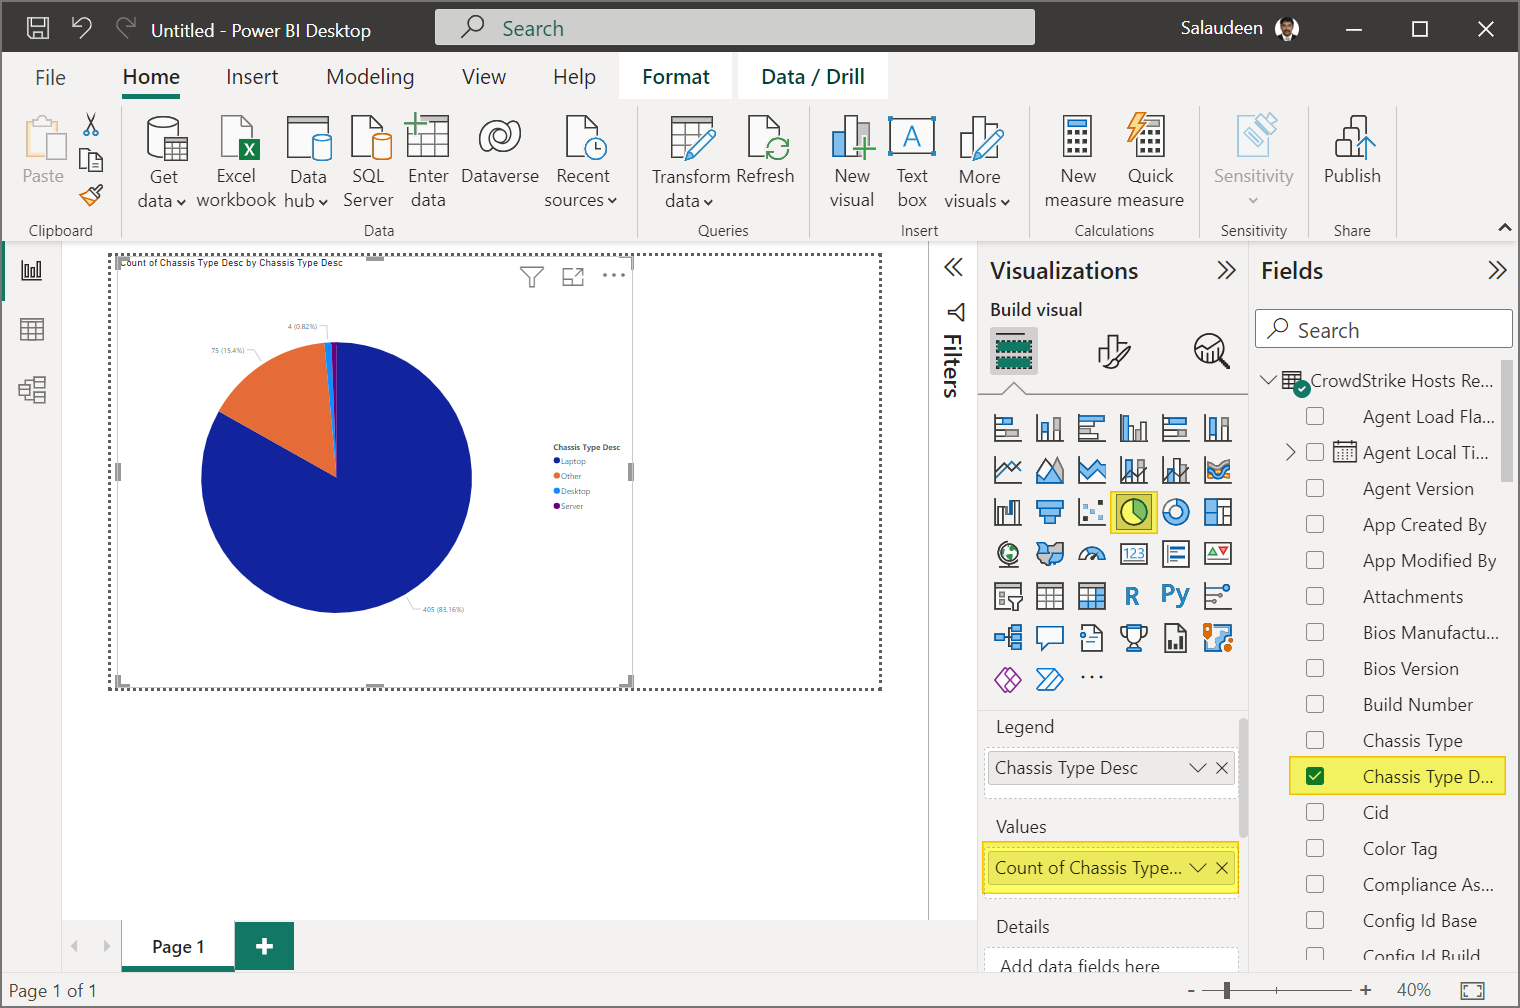
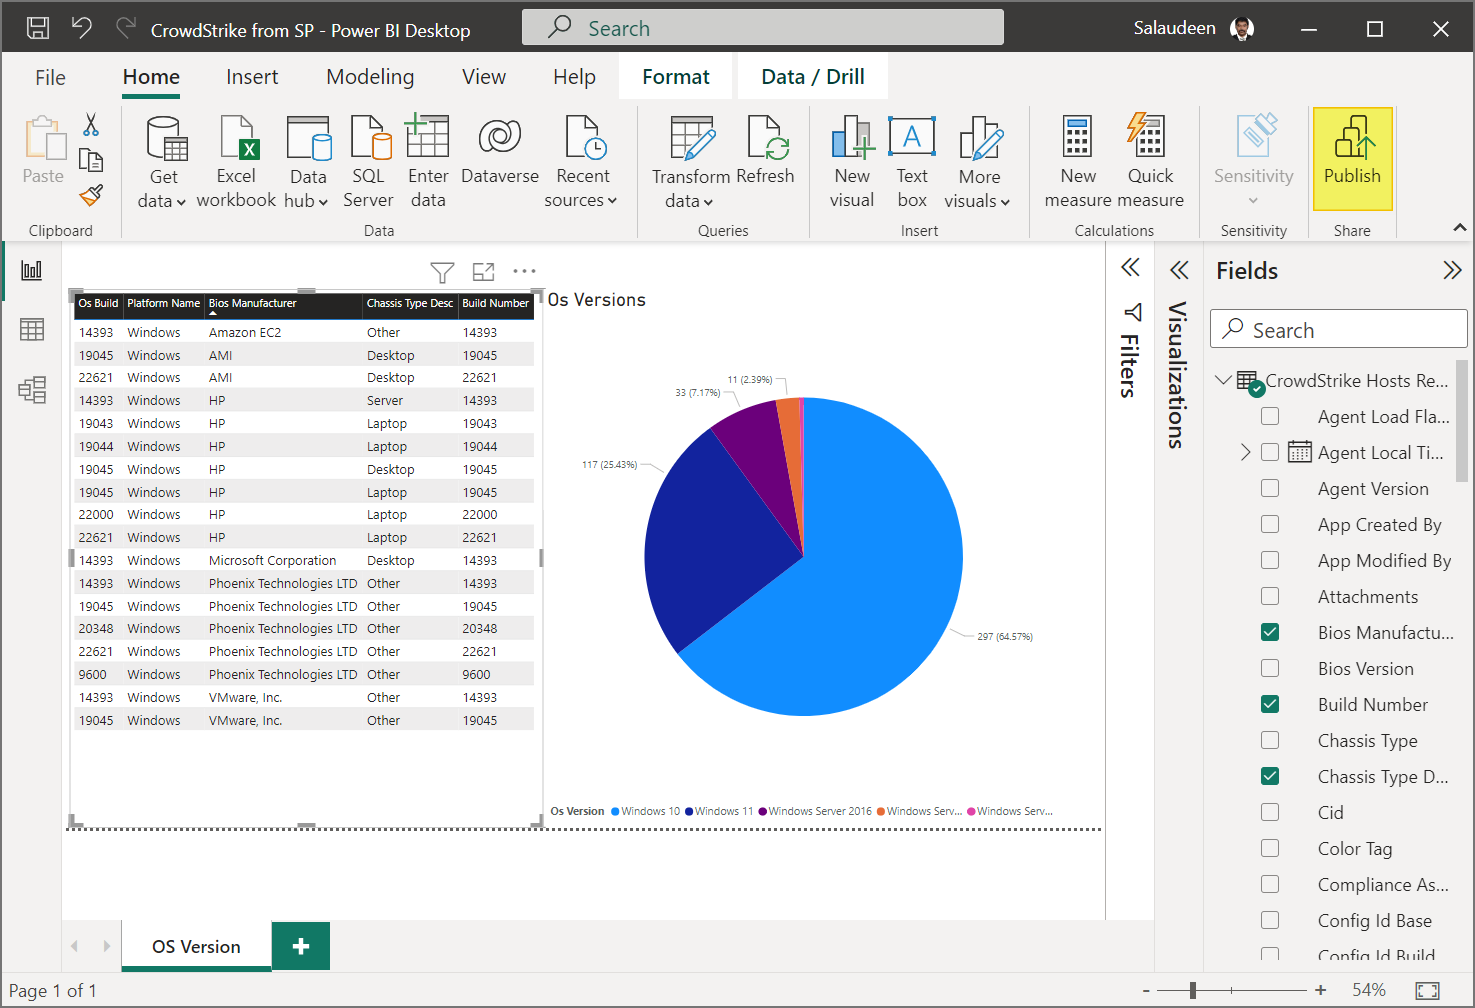
- Add Widgets to the Page: Insert the widgets, such as a Table, Chart, etc., by clicking the relevant icon from the “Visualizations” pane on the page.
- Select Fields to Display: From the “Fields” pane on the right side of the screen, Drag and drop the fields you want to include in your report onto the report canvas. Choose the Data value for each visualization you wish to use for each field. You can easily drag and drop fields onto the report canvas, modify data visualizations, and perform a multitude of other data analysis operations. Rename the column header if needed.

- Customize the report as needed: Add titles, legends, and formatting. You can customize it further by adding filters, slicers, and other interactive elements. You can customize the colors, fonts, and other formatting options to match your organization’s branding.
- Save and Publish the Report: Once you have created your Power BI report, you can save and publish it and share it with others.


That’s all! Now, you have created your report in Power BI. To share your report with others, you can publish it to your workspace on Power BI Service. This allows others in your organization to view and interact with the report.
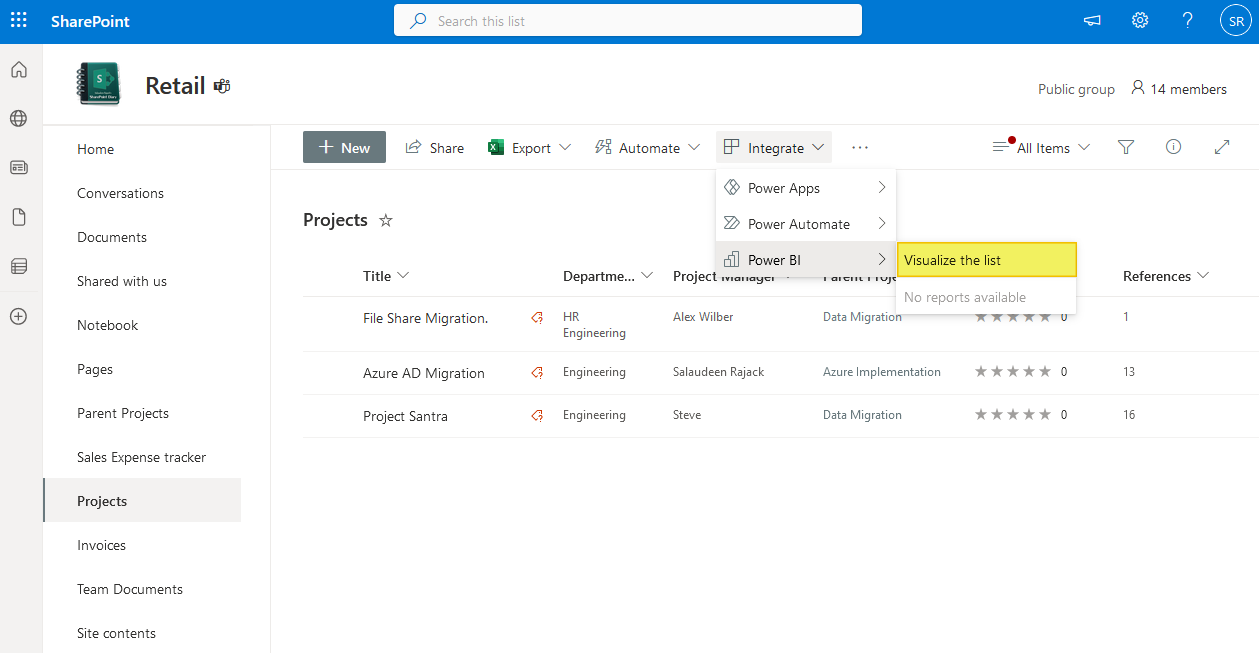
Alternate solution – Create Power BI Report from SharePoint List:
Instead of using Power BI Desktop as the starting point, You can create a Power BI report directly from the SharePoint Online list! Navigate to the list, click on the “Integrate” button in the command bar, Power BI, and then “Visualize the list”. This will generate the report automatically, and then you can customize the report further to meet your requirements.
Tips and tricks for efficient data analysis using Power BI and SharePoint Online
When working with Power BI and SharePoint Online, there are a few tips and tricks that can help you be more efficient and productive. Here are a few:
- Use the “Edit Queries” feature in Power BI to clean and transform your data before importing it into Power BI.
- Use the “Data Model” feature in Power BI to create relationships between tables, allowing for more complex analysis.
- Use the “Quick Measures” feature in Power BI to quickly create common calculations, such as averages and percentages.
- Use the “Drillthrough” feature in Power BI to create interactive reports that allow users to drill down into specific data points.
- Use the “Export to Excel” feature in SharePoint Online to export data from SharePoint Lists into Excel for further analysis.
Best practices for data visualization and presentation in Power BI
When creating reports in Power BI, it’s important to follow best practices for data visualization and presentation. Here are a few tips:
- Keep your reports simple and easy to understand. Be clear on what you are trying to convey with your data.
- Use clear and concise titles and labels.
- Use colors and formatting to highlight important information.
- Use appropriate visualizations for the data you are presenting. Not all data suits all visuals. For instance, use line charts for trends over time, bar charts for comparing different groups, and pie charts for showing the proportions of a whole.
- Avoid clutter and unnecessary elements. Avoid cluttering your reports with too much information.
- Keep the design consistent throughout the report. Use a consistent color scheme, font, and layout.
Incorporating these best practices for data visualization and presentation in Power BI can significantly enhance the impact and usefulness of your data!
Conclusion and next steps
In conclusion, using Power BI to create reports from SharePoint Online Lists is a powerful tool for streamlining data analysis and improving decision-making. By following the steps outlined in this article, you can connect Power BI to SharePoint Online, import SharePoint List data into Power BI, create reports from SharePoint List data using Power BI, customize and share reports from Power BI to SharePoint Online, and implement best practices for data visualization and presentation. With these tools and techniques, you can optimize your data analysis process and make better, more informed decisions. Whether you’re a beginner just getting your feet wet or an intermediate user looking to expand your knowledge, this article simplifies the process of connecting Power BI to SharePoint Lists and unlocking the true power of your data.
If you’re interested in learning more about Power BI and SharePoint Online, there are many resources available online, including tutorials, documentation, and forums. With a little practice and exploration, you can become a Power BI and SharePoint Online expert and take your data analysis skills to the next level.
Yes, you can use Power BI to create reports from multiple SharePoint Online Lists. Simply connect to each list as a data source and combine the data as needed.
To get data from a SharePoint folder in Power BI, you need to first connect to SharePoint Online from Power BI from “Get Data” and select “SharePoint Folder” as the data source. This will load all files and folders from the site. Once you’ve connected, you have to filter the data based on your Folder path.
Yes, you can customize the appearance of your reports in SharePoint Online by adding custom branding and formatting.
Yes, you can share your reports with external users by publishing them on the web or by sharing them via email.
Any changes made to the SharePoint Online list will not automatically update in Power BI. You must click “Refresh” in Power BI to get the most recent data from SharePoint. Consider publishing the report to the Power BI service and schedule refresh, if you want automatic updates.
To embed a Power BI report in SharePoint, you first need to publish the report to the Power BI service. Once the report is published, you can use the embed code or “Embed in SharePoint Online” URL provided by Power BI to add the report to a SharePoint page. You can also customize the size and appearance of the embedded report to fit your needs. Finally, paste the embed code into a SharePoint page Power BI Web Part or Embed web part to display the report.